Friday, May 5, 2017

Climate Controls

Climate Controls
Honolulu has a tropical wet and a dry/savanna climate. The dry/savanna climate is associated with Honolulu’s dry, summer season. The tropical wet climate can be associated with the wet, winter season. There are numerous climate controls on a meso-scale and micro-scale that contributes to the climates in Honolulu.  

Meso-Scale
There are two large mountains on the island of Oahu and the closest one to Honolulu is the Ko’olau Mountain. Honolulu is located on the leeward side of the mountain and the temperatures are impacted by the rain shadow effect. Honolulu is also in proximity to a large body of water, which is the Pacific Ocean. This causes Honolulu to have a high latent heat and humid air. The dominance of the maritime tropical air mass also affects the climate in Honolulu, which cause warm and moist temperatures all year round. Honolulu also experiences secondary atmospheric circulations such as the Hawaiian High-pressure cell and hurricanes. The Hawaiian high is associated with warm and calm weather, while hurricanes are associated with colder weather and more precipitation in the winter.

Micro-Scale
The Honolulu International Airport weather station is located right next to the Pacific Ocean. Therefore, the weather station is in proximity to a large reservoir, which can cause it to record a higher latent heat compared to sensible heat. As well, Honolulu is predominantly urban and contains lots of tall buildings. Therefore its temperature can be impacted by an urban heat island effect, which absorbs more of the sun’s energy leading to an increase in temperatures. Another micro-scale factor that affects Honolulu’s climate is the vegetation. Honolulu doesn’t have much vegetation because it is located on the leeward side. Hence, having less vegetation can cause the albedo to be lower which results in a higher absorption of the sun’s energy at the surface.

Koppen climate classification of Hawaii as a whole. According to this map, Honolulu is classified as an Am (monsoon) climate.
Source: https://en.wikipedia.org/wiki/Climate_of_Hawaii
The vast amount of tall buildings in Honolulu. There is also some vegetation in the area as well.
Source: https://www.ncl.com/port-of-call/honolulu-cruises
Here you can see that Honolulu is relatively dry compared to the other parts of Oahu island.
Source: https://www.quora.com/What-island-is-Honolulu-on

Temperature Trends in January and July over the past 50 years (1960-2016)
January
From 1960-2016, the maximum temperatures in January range from 75-85 ˚F and the minimum temperatures range from 60-70 ˚F. The highest maximum temperature was in 1996 at 84 ˚F and the lowest was in 1979 at 76.5 ˚F. The highest minimum temperature was 69.3 ˚F in 1964 and the lowest was 61.2 ˚F in 1969. The maximum trendline shows that the temperature has been stable with a slight increase. The minimum trendline shows that there has been an increase in the minimum temperatures. 

July
In the past 50 years, the maximum temperatures in July range from 85-90 ˚F and the minimum temperatures range from 70- 77 ˚F. The highest maximum temperature was 90.6 ˚F in 1995 and the lowest was 85 ˚F in 1971. The highest minimum temperature was 77 ˚F in 2005 and the lowest was 71.9 ˚F in 1978. In general, the maximum and minimum trendlines show that there has been an increase in temperature during the past 50 years. 

January mean max. and min. temperatures from 1960-2016
Data Source:
 Lawrimore, Jay (2016). Global Summary of the Month, Version 1.0. [Honolulu International Airport, HI US].NOAA National Centers for Environmental Information. DOI:10.7289/V5QV3JJ5 [February 27, 2017].

July mean max. and min. temperatures from 1960-2016
Data Source: Lawrimore, Jay (2016). Global Summary of the Month, Version 1.0. [Honolulu International Airport, HI US].NOAA National Centers for Environmental Information. DOI:10.7289/V5QV3JJ5 [February 27, 2017].


Honolulu (Honolulu Airport) vs. Maui (Kahului Airport)
Honolulu and Maui are both located in the Hawaiian Islands. However, Honolulu is a city located on the Oahu Island, while Maui is one of the Hawaiian Islands. In terms of Maui, the weather station of focus was the Kahului Airport. Both the Honolulu International Airport (HNL) and Kahului Airport (OGG) weather stations have warm, moist temperatures all year round. As well, the temperatures have never fallen below 60 ˚F throughout the past decades. Both of the weather stations don’t receive much precipitation; however, they both receive the most precipitation in the winter compared to the summer. These locations have a maritime climate, which can infer that they each have a high Bowen ratio above 0.5. They are both affected by the maritime tropical air mass and the Hawaiian high all year round. Another similarity is that they are both affected by orographic barriers like mountains, which causes them to receive warm, dry winds. They are also both affected by the cold front from a mid-latitude cyclone, which brings in the cold air in the winter. Another weather phenomenon both weather stations are affected by is tropical cyclones. There is not much of a weather difference between HNL and OGG except for their location. The HNL is located on the leeward side of the Ko’olau Mountain, while the OGG is located in a valley between the West Maui Mountains and the slopes of Haleakala on the east of OGG. As well HNL is located on the south shore of Oahu and OGG is located on the north shore of Maui. 

Location of the Kahului and Honolulu.
Source: https://www.google.com/maps/place/Kahului,+HI/

Comparison of the temperatures in Oahu and Maui
Source: http://www.govisithawaii.com/hawaii-weather/

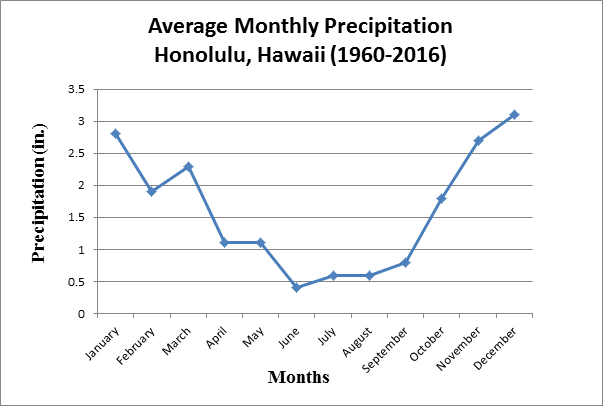
Comparison of the precipitation in Oahu and Maui
Source: http://www.hawaiigaga.com/WeatherGuide.aspx

Sources:


Friday, April 21, 2017

Air Masses, Hurricanes, and Topological Influences

Air Masses
The maritime tropical air mass affects Honolulu all year round because Honolulu is surrounded by the Pacific Ocean and is in the tropics. In addition to the maritime tropical air mass, the Hawaiian High is also around all the Hawaiian Islands. Therefore, these conditions are associated with tropical weather consisting of warm and moist temperatures. This explains why Honolulu experiences tropical weather all year round.  

These are the air masses around the world and it shows how the mT air mass surrounds Hawaii.
Source: http://www.bahrainweather.gov.bh/education_air-mass

Are there Influences of the Mid-latitude Cyclones or the Intertropical Convergence Zone?
Honolulu doesn't experience a mid-latitude cyclone because the Hawaiian High usually deflects it. However, if the Hawaiian High weakens or moves then the cold front of a mid-latitude cyclone can approach the islands5. The cold front would cause the temperature to decrease and cause heavy precipitation5.Generally, the cold front passes the islands during October through April, which would explain why Honolulu receives precipitation during in the winter. In the case of the ITCZ, it moves further north over land than it does over oceans8. For that reason, the ITCZ doesn’t reach Honolulu because it's surrounded by the Pacific Ocean and is further north in the tropic zone.

Here you can see the cold front or tail of the mid-latitude cyclone sweeping the islands.
Source: https://laulima.hawaii.edu

This shows the ITCZ movement patterns in January and July. In the image, you can see that the ITCZ doesn't move up north enough to pass through the Hawaiian Islands.
Source: http://www.bbc.co.uk/education/guides/z9yssbk/revision/2

Hurricanes
Although Honolulu doesn’t experience mid-latitude cyclones or the passage of the ITCZ, it does experience hurricanes. The hurricane season in Honolulu is from June to November1. However, hurricanes rarely occur in Hawaii and are generally weakened when they approach the islands1. Hurricanes rarely occur in Hawaii because the ridge from the Hawaiian High protects the islands and deflects the storms7. In the past 50 years, there were five notable hurricanes that damaged the islands. These hurricanes were Hurricane Hiki (1950), Hurricane Nina (1957), Hurricane Dot (1959), Hurricane Iwa (1982), and Hurricane Iniki (1992)3. Hurricane Hiki was the first official hurricane recorded in the islands and was a category 1 hurricane 3, 4. As for the other hurricanes, Hurricane Nina was a category one, Hurricane Dot was a category 4, Hurricane Iwa was a category one, and Hurricane Iniki was a category four 4. Hence, Hurricane Dot and Hurricane Iniki were the most devastating hurricanes. All of these hurricanes caused severe weather conditions, such as storm surges, heavy precipitation, and high-speed gusts of winds. The hurricanes also caused several damages such as destroying homes, toppling trees, and physical injuries.


Damages inflicted to houses after a hurricane.
Source: http://www.soest.hawaii.edu/met/Faculty/businger/poster/hurricane/
The damages inflicted by the strong gusts of the wind from the hurricane.
Source: http://www.soest.hawaii.edu/met/Faculty/businger/poster/hurricane/


Topological Influences
The weather in Honolulu is influenced by orographic lifting because it’s located on the leeward side of the Ko’olau Mountain. As the NE trade winds are forced over the windward side it cools and condenses. Then as the air mass descends on the leeward side, it dries and warms adiabatically. This causes the leeward side to be dry and have less green areas. Even though the air mass is relatively dry on the leeward side, it can still produce a small amount of precipitation. This explains why Honolulu receives small amounts of precipitation and is relatively dry throughout the year. Though, there are times when Honolulu can receive a large amount of precipitation due to the Kona winds. These are “rain-bearing winds that blow over the islands from the SE or SSW in the opposite direction of trade winds” 9. Therefore the dominant wind pattern is reversed and the leeward sides become windward. However, the Kona winds don’t last more than a day or so 9.

This is a diagram of Orographic lifting
Source: https://laulima.hawaii.edu

This image shows how Honolulu does not have many green areas compared to the windward side of the Koolau Mountain.
Source:https://www.google.com/maps/place/Island+of+Hawai'i/ 


Sources
  1. Climatestoravel.com, (n.d.) Climate-Hawaii. Retrieved from http://www.climatestotravel.com/climate/hawaii
  2. Furman, T. & Guertin, L. (n.d.). Precipitation and the Inter-Tropical Convergence Zone (ITCZ). Retrieved from https://courseware.e-education.psu.edu/courses/earth105new/content/lesson07/03.html
  3. Hawaii News Now. (n.d.a). HNN Hurricane Center. Retrieved from http://www.hawaiinewsnow.com/category/190631/hawaii-news-now-hurricane-center
  4. Hawaii News Now. (n.d.b). Hawaii's Hurricane History. Retrieved from http://www.hawaiinewsnow.com/story/6921152/hawaiis-hurricane-history
  5. Nullet, D. (n.d.a). Weather Patterns from Migratory Lows. Retrieved from https://laulima.hawaii.edu/access/content/group/2c084cc1-8f08-442b-80e8-ed89faa22c33/book/chapter_6/weather_obs/hawweather_front.htm
  6. Nullet, D. (n.d.b). Fronts & Midlatitude Cyclones. Retrieved from https://laulima.hawaii.edu/access/content/group/2c084cc1-8f08-442b-80e8-ed89faa22c33/book/chapter_6/fronts.htm
  7. Thompson, A. (2014). Why Hurricanes Are So Rare in Hawaii. Retrieved from http://www.climatecentral.org/news/why-hurricanes-are-so-rare-in-hawaii-1787
  8. ThoughtCo. (n.d.). ITCZ: The Intertropical Convergence Zone or ITCZ Brings Convectional Precipitation. Retrieved from https://www.thoughtco.com/itcz-143443
  9. Tom Barefoot. (2017). What are the Trade Winds in Hawaii?. Retrieved from https://www.tombarefoot.com/hawaii-information/what-are-the-trade-winds-in-hawaii/5324

Monday, March 6, 2017

Geographical Setting, Average Monthly Weather, and Bowen Ratio of Honolulu, Hawaii

Weather Station Location and Geographical Setting
The weather station I chose is the Honolulu International Airport station located in Honolulu, Hawaii. Hawaii is located in the Pacific Ocean just west of the United States and south of the Tropic of Cancer. Therefore, Hawaii is located in the tropics with a maritime climate (NOAA, 2016). As well, since Hawaii is located between the Tropic of Cancer and the equator it receives northeast trade winds. In terms of Honolulu, it is located on the southeast coast of the third largest Hawaiian Island called Oahu (City-Data, n.d.). 

Here is a broad map that shows the location of Hawaii in the Pacific Ocean. As well, in this image it shows that Hawaii is right under the Tropic of Cancer.
Source: http://www.worldatlas.com/na/us/hi/where-is-honolulu.html


The red outline depicts the area and location of Honolulu in Oahu. 
Source: https://www.google.com/maps/place/Honolulu,+HI/

The red circle on the map indicates where the Honolulu International Airport weather station is located in Honolulu.
Source:  https://www.ncdc.noaa.gov/cdo-web/datatools/findstation

Aside from the Pacific Ocean being a large geographical aspect of Honolulu, there are other beautiful and historical geographical aspects. One other large geographical aspect in Honolulu is the Ko'olau Mountain, which dominates the east side of Oahu (Woods, n.d.). In particular, Honolulu is located on the leeward side of the mountain, which causes it to receive warm air. There are also two craters located in Honolulu which is the Punchbowl Crater and the Diamond Head crater that both formed after a volcanic eruption (Woods, n.d.).

The red navigation point on the map depicts the mid-point of the Ko'olau Mountain. As you can see, the Ko'olau Mountain dominates the entire east side of Oahu, and Honolulu is located near the southeast end of the mountain.
Source: https://www.google.com/maps/place/Ko%CA%BBolau+Range/

The red navigation point shows where the Punchbowl Crater is located. The Diamond Head is the green circle located in the lower right-hand corner of the map.
Source: https://www.google.com/maps/place/Punchbowl+Crater/

Average Monthly Temperatures
Honolulu contains warm temperatures all year round (NOAA, 2016) because its located in the tropics and receives northeast trade winds. The average monthly high's from 1960-2016 ranges from 80.0 ˚F to 88.6 ˚F, with the highest temperature occurring in July and the lowest in December. On the other hand, the average monthly lows ranges from 66.0 ˚F to 74.8 ˚F with the highest temperature occurring in August and the lowest in January. Honolulu is known to have only 2 seasons with very little temperature differences, which is summer (May to October) and winter (October to April) (NOAA, 2016). In general, Honolulu experiences higher temperatures during the summer and lower temperatures during the winter as depicted in the graph below.

Average monthly temperature for Honolulu during 1960-2016.
Data Source: Lawrimore, Jay (2016). Global Summary of the Month, Version 1.0. [Honolulu International Airport, HI US].NOAA National Centers for Environmental Information. DOI:10.7289/V5QV3JJ5 [February 27, 2017].

Graphical representation of the average monthly temperatures.
Data Source: Lawrimore, Jay (2016). Global Summary of the Month, Version 1.0. [Honolulu International Airport, HI US].NOAA National Centers for Environmental Information. DOI:10.7289/V5QV3JJ5 [February 27, 2017]. 

Average Monthly Precipitation
Honolulu generally receives very little precipitation all year round. The average monthly precipitation during 1960-2016 ranges from 0.4 to 3.1 inches. The highest average monthly precipitation is in the month of December, and the lowest is in the month June. When the average monthly precipitation and the overall average monthly temperatures are graphed together, they have an inverse relationship. In other words, the hot summer months receives less moisture compared to the warm winter months. 

Average annual precipitation of Honolulu from 1960-2016.
Data Source: Lawrimore, Jay (2016). Global Summary of the Month, Version 1.0. [Honolulu International Airport, HI US].NOAA National Centers for Environmental Information. DOI:10.7289/V5QV3JJ5 [February 27, 2017].

Graphical representation of the average monthly precipitation from 1960-2016.
Data Source: Lawrimore, Jay (2016). Global Summary of the Month, Version 1.0. [Honolulu International Airport, HI US].NOAA National Centers for Environmental Information. DOI:10.7289/V5QV3JJ5 [February 27, 2017]. 

This graph shows the relationship between the overall average monthly temperatures and average monthly precipitations from 1960-2016. 
Data Source: Lawrimore, Jay (2016). Global Summary of the Month, Version 1.0. [Honolulu International Airport, HI US].NOAA National Centers for Environmental Information. DOI:10.7289/V5QV3JJ5 [February 27, 2017].

Bowen Ratio Guestimate
The Bowen Ratio (BR) tends to be higher in dry regions compared to moist regions. In the case of the Honolulu, it’s a relatively moist/humid region due to the Pacific Ocean supplying moisture into the air (NOAA, 2016). In 2014 the monthly relative humidity ranged from 0.6816-0.7188 which is moderately high (Giambelluca, 2014). As well in 2014, the latent heat flux in Honolulu ranged from 6.736 W/m² - 8.358 W/m². In general, Honolulu's latent heat exchange is likely to be higher than the sensible heat exchange due to its humidity. Since the latent heat will be higher than the sensible heat, the BR for Honolulu will be less than 1 and even perhaps lower than 0.50. 

The graph on the left shows the monthly relative humidity of Honolulu International Airport in 2014. The image on the right shows the annual relative humidity of the Oahu as a whole in 2014. 
Source: http://climate.geography.hawaii.edu/interactivemap.html

The graph shows the monthly latent heat flux of Honolulu International Airport in 2014. The map on the right shows the annual latent heat flux of Oahu as a whole in 2014.
Source: http://climate.geography.hawaii.edu/interactivemap.html 

 Sources:
  • City-Data. (2017). Honolulu: Geography and Climate. Retrieved from http://www.city-data.com/us-cities/The-West/Honolulu-Geography-and-Climate.html
  • Giambelluca, T.W., X. Shuai, M.L. Barnes, R.J. Alliss, R.J. Longman, T. Miura, Q. Chen, A.G. Frazier, R.G. Mudd, L. Cuo, and A.D. Businger. (2014). Evapotranspiration of Hawai‘i. Final report submitted to the U.S. Army Corps of Engineers—Honolulu District, and the Commission on Water Resource Management, State of Hawai‘i.
  • Lawrimore, Jay (2016). Global Summary of the Month, Version 1.0. [Honolulu International Airport, HI US].NOAA National Centers for Environmental Information. DOI:10.7289/V5QV3JJ5 [February 27, 2017].
  • [NOAA] National Oceanic and Atmospheric Adminstration. (2016). Climate of Hawai'i. Retrieved from http://www.prh.noaa.gov/hnl/pages/climate_summary.php
  • Woods, A. (n.d.). Landforms in Honolulu. Retrieved from  http://traveltips.usatoday.com/landforms-honolulu-105259.html